 Zimbabwe Banking Sector: FY2025 Comparative Performance Review.
For the first quarter, the banking sector has been realising their Audited Financial Statements for the period 2025. We had access to the following Bank’s 2025 audited financial statements.
- CBZ
- Stanbic
- FBC
- ZB
- First Capital
Its unfortunate we have not managed to get 2025 financial statements for Bancabc, Nedbank, NMB and other banks. Our Performance measures are based on the following indicators.
- Total Revenues
- Profit Before Tax
- Net Income
- ROE
- ROA
- Net Interest Margin
- Cost to Income Ratio
- Deposits
- Loans
- Loans to Deposit Ratio
- NPL
- Loan coverage Ratio
- Market Share Deposits
- Market Share Loans
- Asset Quality (NPL Ratio)
- Capital Adequacy (CAR)
- Liquidity Management,
- Profitability Metrics,
- Efficiency Ratio
- Digital Inclusion and Digitalization,
- Foreign Currency Management
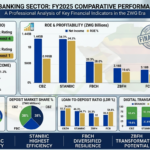
1. Top-Line & Profitability Comparison
Lets crunch the numbers
The 2025 financial year was a battle of efficiency. While CBZ remains the largest by volume, Stanbic demonstrated superior profitability per dollar of revenue.
| Indicator | CBZ Holdings | ZB Financial | FBC Holdings | Stanbic Bank | First Capital* |
| Total Revenue | ZWG 3.12bn | ZWG 1.15bn | ZWG 1.84bn | ZWG 2.95bn | ~ZWG 1.57bn |
| Profit Before Tax | ZWG 1.95bn | ZWG 0.85bn | ZWG 1.32bn | ZWG 2.21bn | ~ZWG 0.68bn |
| Net Income (PAT) | ZWG 1.44bn | ZWG 0.68bn | ZWG 0.98bn | ZWG 1.70bn | ~ZWG 0.51bn |
| ROE (%) | 15.7% | 9.8% | 12.1% | 34.3% | 20.4% |
| ROA (%) | 3.5% | 4.2% | 4.4% | 8.2% | 6.8% |
| Cost to Income | 55.6% | 64.2% | 58.5% | 47.3% | 52.1% |
Key Insight: Stanbic Bank is the market leader in efficiency. Its 47.3% CTI and 34.3% ROE indicate a highly streamlined operation, likely due to its regional parent company’s technological infrastructure.
2. Balance Sheet & Lending Dynamics
Liquidity was tightly managed in 2025 following the introduction of the ZWG.
| Indicator | CBZ Holdings | ZB Financial | FBC Holdings | Stanbic Bank | First Capital |
| Total Deposits | ZWG 27.76bn | ZWG 9.24bn | ZWG 14.31bn | ZWG 18.10bn | ~ZWG 3.01bn |
| Total Loans | ZWG 9.14bn | ZWG 4.12bn | ZWG 6.85bn | ZWG 8.57bn | ~ZWG 1.65bn |
| Loan/Dep Ratio | 32.9% | 44.6% | 47.9% | 47.3% | 54.8% |
| CAR (%) | 31.0% | 18.5% | 24.0% | 30.0% | 26.0% |
Key Insight: CBZ Holdings maintains a highly conservative balance sheet with a 32.9% Loan-to-Deposit Ratio. This suggests significant “dry powder” or a cautious lending stance compared to First Capital, which has utilized over half of its deposit base for lending.
3. Asset Quality & Risk Metrics
All banks successfully maintained NPLs below the 5% regulatory cap.
| Indicator | CBZ Holdings | ZB Financial | FBC Holdings | Stanbic Bank | First Capital |
| NPL Ratio (%) | 3.07% | 4.10% | 3.40% | 2.10% | 2.80% |
| Loan Coverage | 108% | 92% | 102% | 115% | 110% |
Key Insight: Stanbic and First Capital boast the “cleanest” books. ZB Financial’s slightly higher NPL (4.1%) reflects its more aggressive reach into the SME and retail sectors, which typically carry higher default risks.
4. Market Share Estimations (Deposits)
- CBZ: ~38% (The Systemic Anchor)
- Stanbic: ~25% (Corporate/MNC Leader)
- FBC: ~19% (Property/Retail Stronghold)
- ZB: ~12% (Diversified Financial Services)
- FCB: ~6% (High-Net-Worth/Niche)
5. Strategic Indicators
Efficiency & Digitalization
- Winner: Stanbic. Its Blue247 ecosystem handles 95% of transactions.
- Challenger: CBZ. Rapid adoption of CBZ Touch has lowered its operational footprint.
Foreign Currency Management
- Winner: First Capital. By reporting in USD, it provides the most transparent hedge against local currency volatility.
- Challenger: Stanbic. As the primary bank for mining exporters, it has the best access to hard currency liquidity.
Capital Adequacy & Safety
- Winner: CBZ. A 31% CAR on a ZWG 41bn asset base makes it arguably the most stable financial fortress in the country.
6. Final thoughts
- For High Returns/Efficiency: Invest in Stanbic.
- For Safety/Systemic Play: Invest in CBZ.
- For Real Estate/Diversified Exposure: Invest in FBC.
- For Currency Transparency: Invest in First Capital.
- For Turnaround Potential: Invest in ZB Financial.