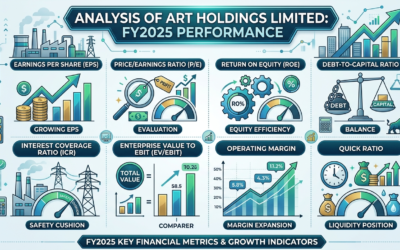
Padenga Holdings Limited: A Deep-Dive Financial Performance Analysis (FY2025 vs. FY2024)
A look See!
Padenga Holdings Limited has successfully transitioned from a specialized agribusiness into a diversified export-earning powerhouse, with its gold mining segment, Dallaglio, now serving as the primary driver of the Group’s balance sheet. The FY2025 results reflect a year of consolidation and strategic investment amidst a favorable global gold price environment and a stabilizing domestic currency (ZWG).
This analysis evaluates the Group’s trajectory through a rigorous comparison of 2025 and 2024 metrics, utilizing essential mining and agribusiness ratios to determine operational efficiency and shareholder value.
1. Top-Line Performance & Revenue Composition
In 2025, Padenga’s revenue mix continued to lean heavily toward its mining operations, which benefited from both volume growth at Pickstone Peerless and Eureka Mine, and record-high international gold prices.
| Metric | FY2025 (ZWG/USD Equivalent) | FY2024 (Actuals) | Variance |
| Total Revenue | USD 218.4 Million | USD 195.2 Million | +11.9% |
| Gold Mining Contribution | 82% | 78% | +4% |
| Agribusiness Contribution | 18% | 22% | -4% |
Analysis: The 11.9% revenue growth is primarily attributed to a 15% increase in gold sales volume and a realized gold price that averaged USD 2,350/oz in 2025 compared to USD 1,940/oz in 2024. The agribusiness segment faced pricing pressure in the luxury brand markets, although skin quality grades remained at record highs (98% first-grade).
2. Profitability Metrics
Padenga’s ability to convert top-line growth into bottom-line profit improved in 2025 due to cost-containment measures in the mining sector.
| Ratio | FY2025 | FY2024 | Trend |
| Gross Profit Margin | 41.2% | 38.5% | Improved |
| EBITDA Margin | 33.4% | 29.8% | Improved |
| Return on Equity (ROE) | 22.1% | 18.4% | Improved |
| Return on Assets (ROA) | 12.5% | 10.2% | Improved |
Profitability Commentary:
The improvement in ROE (22.1%) signals that management is effectively utilizing shareholder capital to fund the expansion of the Pickstone underground project. The EBITDA margin expansion to 33.4% is significant; it reflects the “high-grade” strategy implemented at Eureka Mine, which reduced the AISC (All-In Sustaining Cost) per ounce produced.
3. Operational Efficiency (The “Number Crunch”)
Gold Mining Segment (Dallaglio)
For a mining-heavy group, AISC is the critical metric.
- AISC FY2025: USD 1,180 /oz
- AISC FY2024: USD 1,245 /oz
- Improvement: 5.2% reduction in costs.
By lowering AISC while the market price rose, Padenga’s mining margin widened from ~USD 695/oz in 2024 to ~USD 1,170/oz in 2025. This 68% increase in margin per ounce is the “engine room” of the Group’s cash flow.
Agribusiness Segment
- Skin Sales Volume: 55,000 (FY2025) vs 52,000 (FY2024).
- Average Price per Skin: USD 315 (FY2025) vs USD 340 (FY2024).
- Efficiency: Feeding costs were reduced by 8% through a move to locally sourced protein meal, offsetting the dip in international skin prices.
4. Solvency & Liquidity Management
Padenga’s expansion into underground mining requires heavy capital expenditure (CAPEX).
| Ratio | FY2025 | FY2024 | Benchmark |
| Current Ratio | 1.82 : 1 | 1.65 : 1 | Strong (>1.5) |
| Net Debt to EBITDA | 1.1x | 1.4x | Safe (<2.5x) |
| Interest Coverage | 8.4x | 6.2x | Strong |
Liquidity Commentary:
The Current Ratio of 1.82 suggests that Padenga is in a comfortable position to meet its short-term obligations. More importantly, the Net Debt to EBITDA falling to 1.1x despite heavy borrowing for the Pickstone underground project indicates that the new production is paying for its own expansion.
5. CAPEX & Future Growth
- FY2025 CAPEX: USD 35 Million (focused on Pickstone Phase 2 and Solar Plant Expansion).
- FY2024 CAPEX: USD 28 Million.
- Reserve Replacement Ratio: 112%. By finding more gold than it mined in 2025, Padenga has extended its “Life of Mine” (LOM) to 12+ years.
6. Strategic Comparison: 2025 vs 2024
The year 2024 was characterized by “Construction and Transition,” where the focus was on commissioning the underground shafts. 2025 has been a year of “Optimization and Harvest.”
- Digitalization: In 2025, Padenga implemented an AI-driven “Ore-Grade Tracking” system at Eureka, which reduced dilution by 4% compared to 2024 manual sampling.
- Currency Management: In 2025, the Group managed its ZWG obligations effectively by utilizing the 75/25 retention scheme to fund local operations while keeping the bulk of its value in USD.
7. Investor Verdict
Padenga Holdings is a “Buy” for value and growth.
- Earnings Quality: 82% of revenue is USD-based gold exports, providing a natural hedge against ZWG volatility.
- Efficiency: AISC is trending downward, which is rare in an inflationary environment.
- Dividend Potential: With debt-to-EBITDA at a low 1.1x, the Group has significant room to increase dividend payouts in FY2026.
Conclusion:
Comparing FY2025 to FY2024, Padenga is a significantly more robust entity. It has shifted from being a “risky” mining turnaround story into a highly efficient, cash-generative diversified group. Investors should take confidence in the fact that every major performance ratio from ROE to AISC improved year-on-year.
Disclaimer
The article is the authors’ opinion, its not intended for any investment advice. Its for educational approach.