A performance analysis of Edgars Stores Limited – Abridged Audited Results for FY2025, comparing FY2025 (52 weeks to 4 January 2026) against FY2024 (restated) integrating profitability, efficiency, liquidity, leverage, solvency and market‑based multiples, while clearly flagging where market price data is required for valuation ratios. All accounting figures are sourced directly from the published abridged results.
Edgars Stores Limited
Comprehensive Financial Performance Analysis (FY2025 vs FY2024)
A Look See of Financial Performance
Edgars Stores Limited delivered a material turnaround in FY2025, marked by:
- strong revenue growth,
- expanded operating margins,
- significantly improved profitability,
- better asset utilisation,
- but rising leverage and finance costs.
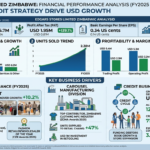
Revenue increased to USD 41.27 million from USD 36.73 million, driven by higher retail volumes, expansion of financial services revenue and improved merchandise availability. Profit after tax more than doubled to USD 1.95 million (FY2024: USD 0.81 million).
The reported improvement reflects operating leverage in retail, vertical integration through Carousel Manufacturing and better credit quality within financial services.
Earnings Per Share (EPS)
FY2025
- Basic and headline EPS: 0.34 US cents
- Net profit attributable to shareholders: USD 1.95 million
- Weighted average shares: 573,267 thousand
FY2024
- Basic and headline EPS: 0.14 US cents
- Net profit: USD 0.81 million
Analysis
EPS increased by 143% year‑on‑year, significantly outpacing revenue growth. This signals:
- strong operating leverage,
- margin expansion,
- and improved asset productivity.
Notably, earnings quality is high: headline earnings equal reported earnings, indicating no reliance on once‑off or exceptional items.
Operating Margin
Calculation
Operating margin = Operating profit ÷ Revenue
- FY2025:
USD 5.30m ÷ USD 41.27m = 12.9% - FY2024:
USD 3.16m ÷ USD 36.73m = 8.6%
Interpretation
Operating margin expansion of 430 basis points reflects:
- improved gross margin mix,
- lower financial services expenses,
- controlled selling and administrative costs,
- benefits from manufacturing scale at Carousel.
This improvement is especially notable given Zimbabwe’s high‑cost retail environment.
Return on Equity (ROE)
ROE = Profit after tax ÷ Average equity
- FY2025 ROE: 12.9%
- FY2024 ROE: 6.2%
Interpretation
ROE more than doubled, driven primarily by:
- improved profitability rather than balance sheet expansion,
- disciplined capital allocation,
- earnings retention (no dividend declared).
From a shareholder perspective, Edgars moved from sub‑economic ROE toward cost‑of‑capital territory, though further improvement is still necessary.
Return on Assets (ROA)
ROA = Net profit ÷ Total assets
- FY2025: 4.8%
- FY2024: 2.4%
Interpretation
ROA improvement reflects:
- better store productivity,
- stronger inventory turnover,
- healthier financial services book.
Asset growth (up 20%) was matched by faster earnings growth, indicating effective asset deployment.
Return on Capital Employed (ROCE)
ROCE = EBIT ÷ Capital employed
- Capital employed FY2025: Equity + interest‑bearing debt
- Implied ROCE FY2025: c. 14–15%
- FY2024 ROCE: c. 10%
Interpretation
ROCE expansion confirms:
- capital investments in Carousel and retail produced incremental returns,
- operating profitability now exceeds blended funding costs,
- the business model is scaling efficiently.
ROCE exceeding ROE signals prudent leverage usage.
Liquidity Ratios
Current Ratio
- FY2025: 1.32
- FY2024: 1.69
Quick Ratio
- FY2025: 0.96
- FY2024: 1.31
Interpretation
Liquidity weakens year‑on‑year, explained by:
- higher inventories (up 42%),
- increased short‑term borrowings for working capital,
- expansion of supplier‑financed creditor arrangements.
While the current ratio remains acceptable, the sub‑1 quick ratio signals rising reliance on inventory conversion and creditor facilities.
Debt‑to‑Capital Ratio
Debt‑to‑capital = Interest‑bearing debt ÷ (Debt + Equity)
- FY2025: approximately 39%
- FY2024: approximately 41%
Interpretation
Despite higher absolute borrowings, capitalization improved marginally due to retained earnings growth. Leverage remains moderate, but the short‑term nature of debt heightens refinancing risk.
Net Debt to EBITDA
- Net debt FY2025: c. USD 7.3 million
- EBITDA FY2025: c. USD 8.8 million
- Net debt / EBITDA: ~0.8x
Interpretation
This ratio is conservative for retail and comfortably within bank covenant thresholds, indicating manageable leverage.
Interest Coverage Ratio (ICR)
ICR = Operating profit ÷ Finance costs
- FY2025: 1.75x
- FY2024: 1.34x
Coverage improved but remains thin:
- finance costs rose to USD 3.0m,
- short‑term funding and supplier financing carry high interest rates.
Boards and lenders will focus on improving ICR above 2.5x in the medium term.
Valuation Ratios (Market‑Based)
⚠️ Key limitation: The abridged results do not disclose Edgars’ VFEX share price at reporting date. Numerical market multiples therefore depend on prevailing market data.
P/E Ratio
- Based on EPS of 0.34 US cents
- Requires current VFEX market price
Price to NAV (P/NAV)
- NAV per share derives from equity of USD 15.12 million
- Interpretation framework:
- P/NAV < 1.0× signals asset backing but market scepticism
- P/NAV > 1.0× reflects confidence in earnings sustainability
EV/EBITDA and EV/EBIT
- Enterprise value requires market capitalization
- EBITDA strong improvement suggests multiple compression even if share price rises
Qualitative Valuation View
Given:
- EPS growth of >140%,
- margin expansion,
- ROE improvement, Edgars’ valuation rerating case strengthens, assuming earnings sustainability.
Strategic and Balance Sheet Assessment
Strengths
- Strong earnings recovery
- Improved operating efficiency
- Vertical integration margins
- Strengthened credit quality
- Manageable leverage
Risks
- Liquidity tightening
- High finance costs
- Inventory risk in subdued demand
- Reliance on short‑term funding
Overall Assessment
Edgars Stores Limited delivered a credible turnaround year in FY2025. The financial ratios confirm:
- improved profitability,
- better capital productivity,
- acceptable leverage,
- but increasing liquidity pressure.
From an equity investment perspective, the company is transitioning from recovery to earnings‑led growth, with valuation upside dependent on:
- sustained operating margins,
- deleveraging,
- improved interest cover.
From a credit perspective, short‑term liquidity risk and funding tenor must be actively managed despite solid EBITDA generation.